Watts, FTP, lactate threshold, RPE… If you’re new to triathlon training, the sheer number of complex terms is enough to make your head spin!
In any sport, you’re going to have specific verbiage, but since triathlon is three sports in one, there’s a triple whammy of things you need to learn.
After chatting with a friend on a recent bike ride:
“What’s an FTP test?”
“What are watts?”
“What’s zone 2 training?”
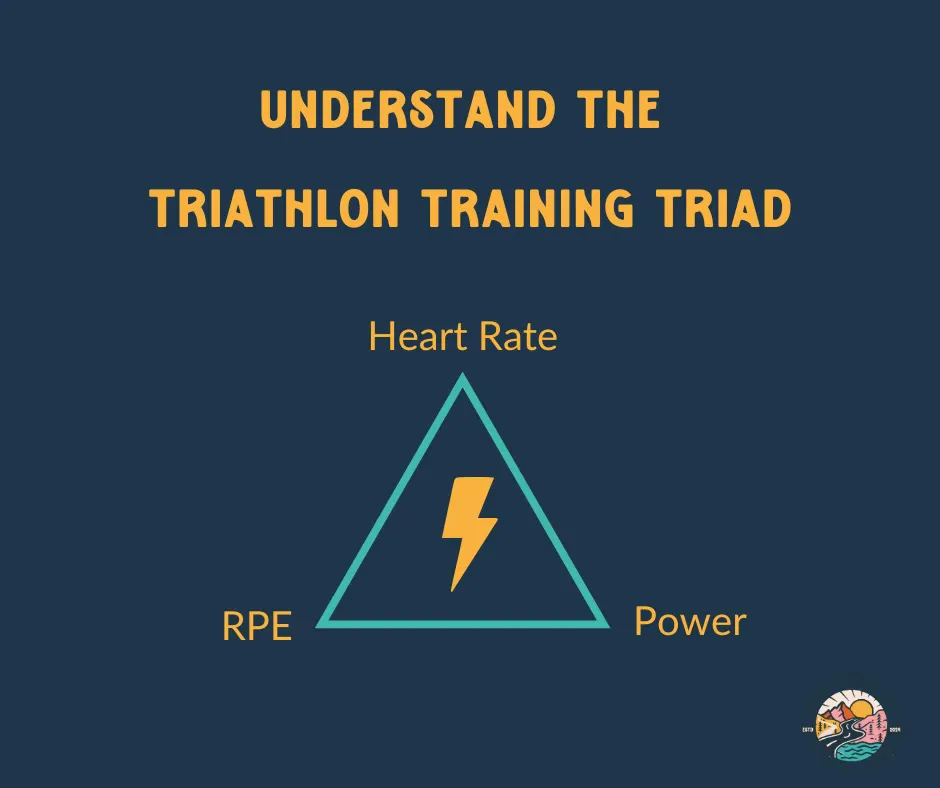
I decided to write about the three components of the Triathlon Training Triad- RPE, heart rate, and power. These are the big three, but we’ll also meet their close cousins, pace and cadence.
Understanding RPE
RPE stands for Rate of Perceived Exertion. It’s a 1-10 scale that’s used to identify how hard, or easy, an effort feels to you.
My friend, Jim Rutberg, at CTS Coaching wrote a great article about using RPE in training and racing. Here’s a 1-10 RPE scale with descriptions.
- 1- Little to no effort, like walking your dog.
- 2-3- Active recovery, you can talk and breathe freely.
- 4-5- Aerobic pace- All day pace, breathing isn’t too labored and you can speak in sentences.
- 6- Tempo pace- Breathing somewhat hard, can still speak in short sentences.
- 7- Lactate threshold- Challenging, focused breathing, can only speak a few words.
- 8-9- Time trial- Can’t speak. Hard effort with deep labored breathing.
- 10- All out effort. Sprinting. You can’t sustain this effort for more than 30 seconds or 2-5 minutes.
If you’re racing a sprint triathlon, prepare to hang out in the 8-10 range. But if you’re racing a long course triathlon, like a 70.3 or Ironman, that effort level would be too high. Instead, it might be more of a 4-6.
RPE can vary among discipline as well. For example, if you’re an excellent swimmer, then it might take a very hard workout for you to rate it a 7 out of 10. But if you’re not an experienced runner, then many of your workouts might feel like a 7 out of 10.
Sometimes, athletes struggle with a faulty RPE scale. I wrote this post about my own perception problems with RPE and the bad habit of rating every workout on a 6-10 scale. (I’ve been working on this!)
RPE is about perceived exertion so it can vary from workout to workout and day to day. One day, your easy run might feel like a 3 out of 10 because you got 8 hours of sleep, work is low stress, and it’s 60 degrees and sunny. On the other hand, that same easy run might feel like a 7 out of 10 if you got 5 hours of sleep, your boss is being annoying, and it’s 80 degrees and humid.
Changes in RPE can act as an early warning sign of fatigue or illness. If your typical trainer ride feels more like a 7 instead of the typical 4, that’s a sign something isn’t quite right.
You can also measure training progress with RPE. If climbing hills on the bike used to feel like a 7, but now it feels more like a 4, that’s a sign of progress because you’re able to complete the same activity with less effort.
But why do we even care what an effort feels like? Shouldn’t we focus more on metrics like speed and pace- the things that are going to get us to the finish line faster?
Not necessarily.
RPE helps us learn how to accurately gauge effort without relying on technology.
Have you ever had your watch fail during a race? I have.
Ever had your power meter run out of battery on a training ride? It’s happened to me.
If all your technology fails, you need to know what it feels like to race at a certain intensity. I do this a lot with swimming. I have a different breathing pattern I use for easy, half-ironman, Olympic, and sprint pace, so I can dial in that effort without ever looking at the pace on my watch.
Understanding Heart Rate Zones
As your effort level increases during exercise, so does your heart rate. Basically, heart rate training involves setting zones that designate different levels of effort. These zones will be a percentage of your maximum heart rate and lactate threshold- the point when your body switches from the aerobic to anaerobic energy system.
Here’s an example from Training Peaks.
- Zone 1- Recovery- Less than 85% of LTHR
- Zone 2- Aerobic- 85%- 89% of LTHR
- Zone 3- Tempo- 90%- 94% of LTHR
- Zone 4- Sub threshold- 95%- 99% of LTHR
- Zone 5a- Super threshold- 100%- 102% of LTHR
- Zone 5b- Aerobic capacity- 103%- 106% of LTHR
- Zone 5c- Anaerobic capacity- 106%+ of LTHR
(LTHR stands for lactate threshold heart rate, which is the point when lactate accumulates faster in the blood than you can remove it. To understand the difference between aerobic and anaerobic, read this article I wrote for Tri Mag.)
So you need to know your max heart rate and lactate threshold in order to set heart rate zones, but how do you find those values?
By doing a time trial. Yay! No joke, these aren’t fun, because the whole purpose is to find your maximum heart rate, remember?
Something to keep in mind is that your heart rate zones will likely be different for each swimming, cycling, and running. Therefore, you will need to do separate testing for each discipline.
TIP: A heart rate strap you wear around your chest is typically more reliable than a wrist-based heart rate.
Time Trial Examples:
A basic time trial for swimming might include a 1K best effort, 400 yard best effort, 200 yard best effort, or 5 x 100 yards. Then, your pace and heart rate is extrapolated from that effort.
A basic cycling time trial might include warming up for 5 minutes and then doing a 20-minute all-out effort to set your zones.
The same can be done with running by doing a 30-minute all-out effort where your heart rate during the last 20 minutes establishes your zones. A 5K can also be used as a time trial.
Another great option is a 40-minute long test where during each 10-minute section you run as fast as you can while keeping your heart rate under a certain number. For example, the first 10 min. might be under 140bpm, then the next 10 min. under 150 bpm, 160 bpm, and then 170 bpm. It provides a better analysis of the pace you can run and which zones need to be targeted to improve.
This article has a few examples of different versions of these tests.
This is type of testing is referred to as benchmark testing. It should be repeated a few times throughout the year to make sure heart rate zones are set correctly.
As your fitness increases, your heart rate zones may change over time. That’s why regular testing is important to reset zones as needed. It’s also a measure of increased fitness. For example, maybe you used to run a 9:00 minute mile at 164 bpm, but now you can run a 9:00 minute mile at 154 bpm. That’s a sign your heart is becoming more efficient!
Tip: Avoid getting caught up in the numbers. Heart rate varies widely among athletes, genders, and experience level. Two similar athletes may have very different zones. That’s reflective of their physiology, not indicative of their athletic ability.
Once the zones are set, you can use them as a guide to help dial in your effort for workouts and races. For example, if you’re racing a sprint triathlon, your heart rate will likely be in zone 4-5 or 80-100% of max heart rate. But if you’re racing a 70.3 or an Ironman, that effort level would be too high to sustain for a longer distance.
You’ve probably heard of the 80/20 rule in triathlon training. Scientific research has shown that endurance athletes gain the most fitness when doing 80% of their training at low intensity (zone 1-2) and 20% of training at high intensity (zone 4-5).
A 2011 study of age-groupers training for an Ironman did just 69% of training at low intensity and 25% at moderate intensity.
The problem is that most age-group athletes train in the gray zone of moderate intensity. They don’t train easy enough on easy days so they accumulate too much fatigue and therefore can’t train hard enough on hard days. This results in the dreaded fitness plateau. You don’t get any slower, but you don’t get any faster either.
But while training with heart rate can serve as a helpful guide, it isn’t a perfect metric. It’s very finicky. Heart rate is easily affected by external conditions like the weather, fatigue, stress, the timing of your cycle, sleep quality, sickness, ect.
On a 60 degree day, when you’re rested and have low stress, you might be able to run a 9:00 min. mile at 154 bpm. On a 80 degree day, when you’re tired and cranky, running a 9:00 min. mile might produce a heart rate of 170 bpm.
That’s why power is a more reliable indicator of effort than heart rate and RPE. It’s not affected by external conditions.
Understanding Power
Power is a measurement of energy defined in watts, just like a light bulb. When talking about triathlon training, power is generated in two ways- through force and cadence.
For example, you might pedal at a low cadence of 65 rpm and produce 140 watts, which causes your bike to go 20 mph. You could also pedal at a much higher cadence of 85 rpm, produce 135 watts, and ride at 20 mph. The first is more muscular effort and the second is more cardiovascular effort.
Unlike heart rate (measured with a strap) and RPE (free!) power is the metric in the triathlon training triad that requires some investment. I didn’t have a power meter for the first 4 years of doing triathlon.
Tip: Power meters come in different forms- crank or pedals. I have a Stages crank, while my husband has Garmin power pedals. They do the same thing, but the crank stays on my tri bike, while my husband can move his pedals to other bikes.
But why do I need to look at power? Can’t I just look at my speed?
You can, but miles per hour is an imperfect metric that can be affected by external conditions like wind or hilly terrain.
Imagine you’re riding your bike on a beautiful day. Your heart rate is in zone 2, your RPE is 3, you’re producing 140 watts, and you’re traveling at 20 mph.
Now, imagine riding your bike into a massive headwind on a hot day. Your heart rate is in zone 7, your RPE is 8, and you’re producing 180 watts, but you’re traveling at 16 mph.
If you’re just looking at mph, you’re probably going to be frustrated that your heart rate and effort doesn’t match the speed you’re traveling.
Power is absolute. It’s real-time data on the work being done.
Power is used to set functional threshold power, much in the same way that max heart rate is used to set heart rate zones. This is done with a Functional Threshold Power (FTP) test.
If you have an online training platform like Zwift or Trainer Road, you’re in luck because they have many different FTP tests. But you can also do a regular time trial out on the road the same way you did to establish heart rate zones- an all out effort for 20 minutes. (A “true time trial” is an all out effort for 60 minutes, but this is rarely done because of the amount of recovery required, so most tests provide an estimate.)
Once your zones are set, you will be able to see what power range you “should” be able to hold for a specific effort level or race distance. For example, 125-135 watts for an Ironman, 135-145 watts for a 70.3, 150-160 watts for an Olympic, and 170+ for a sprint.
There’s something to consider when thinking about watts. And that’s how much you weigh.
TIP: Just like with heart rate, avoid assigning value to numbers, ie. “My FTP is 240, so I’m a better cyclist than someone whose FTP is 170…” A bigger rider will be able to push more force than a smaller rider. But a smaller rider has less mass to carry, so that cyclist might go faster over a certain distance. A more accurate assessment is watts per kilogram.
Something else to consider are the values you see on your power meter. There’s average power and normalized power.
Average power is an average of the watts you produce during a ride, so it includes all the zeros, like when you’re coasting down a hill or drafting. Normalized power de-emphasizes periods of low output and emphasizes higher output.
For example, think about a one-hour ride on a flat course with an average of 150 watts. Now, think about a one-hour ride on a hilly course with spikes of 250 watts when riding uphill and 50 watts when riding downhill. While the average power still might be 150 watts, the hilly ride is going to feel a lot harder because of the high intensity sections.
Normalized power provides a better reflection of what your body is actually feeling at a given effort. This is what I keep my power meter on during races.
TIP: You can spike your power, within reason, especially when climbing on a hilly course. But keep in mind that you only have so many matches to burn, and those efforts take a toll that will catch up with your legs on the run.
For more info, here’s an article I wrote for Tri Mag about the difference between normalized power and average power.
Combining RPE, Heart Rate, and Power
Some athletes only use RPE to determine effort. Some athletes use RPE and heart rate. Some athletes use RPE, heart rate, and power.
I find that the most effective method is cross referencing all three.
This great article from Training Peaks includes all three metrics: heart rate, power, and RPE and correlates them with percentage of max heart rate and different race distances.
During a race, I keep an eye on my heart rate and power. Then, I also think about what that effort feels like, because ultimately it doesn’t matter what the numbers show. If it feels like I’m racing at a 10 out of 10, there simply aren’t any gears left.
You also have to keep in mind that metrics (even power) don’t tell the whole story. Any benchmark testing you’ve done is just an estimate of your ability to cover a certain distance, not the limit. Who’s to say that you can’t push 10-20 watts higher or run :30 faster on a spectacular race day when you’re feeling amazing and the adrenaline is high?
“Working with power and heart rate can put a ceiling over the athlete’s head, and they miss all the magic that’s just above, that’s totally achievable… I want my athletes empowered, confident, and knowing exactly what a certain effort feels like, so they’ll go for that feeling on race day and reach levels they couldn’t imagine.”- Siri Lindley
That’s why I think using objective measurements (like heart rate and power) along with subjective measurements like (RPE) is the best strategy for success.
News & Notes:
Swim– I read this intriguing post with 4 reasons why your open water times are slower than your pool times.
Bike– Over the weekend, Kristen Faulkner won Olympic gold in the women’s road race. She’s the first American to win a medal in the event in 40 years. But she didn’t even come to the Olympics for the road race. She’s a track cyclist who was subbed in after a fellow athlete couldn’t participate.
Run– I’m working on a 6-part series for the XTERRA Trail Run World Championship. #2features 59-year-old Salima from France. She’s the seventh of 14 children and of Algerian ancestry. She didn’t start running until the age of 49. This quote really stuck with me: “My upbringing was very strict, and girls had more of a place in the kitchen and in housework. Sport was considered useless, an inaccessible luxury, even for my brothers.”
Question of the Day:
Jen– Where did you get your running hydration belt?
Brittany– I use the Naked Run belt that has a double layer of compressive fabric. I use it to carry two 10.5 oz. bottles and it can also store a bunch of gels. It doesn’t bounce at all and is super comfortable. It even has a number attachment for races. I use it for Ironman and 70.3 races. Just make sure you get the right size.


